Statistics is important for understanding the progress of crash report analysis. For example, statistics may show how many crash reports have been received, what are the most popular crash types, how many bugs have been opened and/or fixed, what bugs have been modified recently and so on.
CrashFix can present statistics in form of text summaries and diagrams (pie charts or line graphs). In order to see the statistics for the currently selected project, click the Digest button on the Main menu. Digest page appears (shown in the figure below).
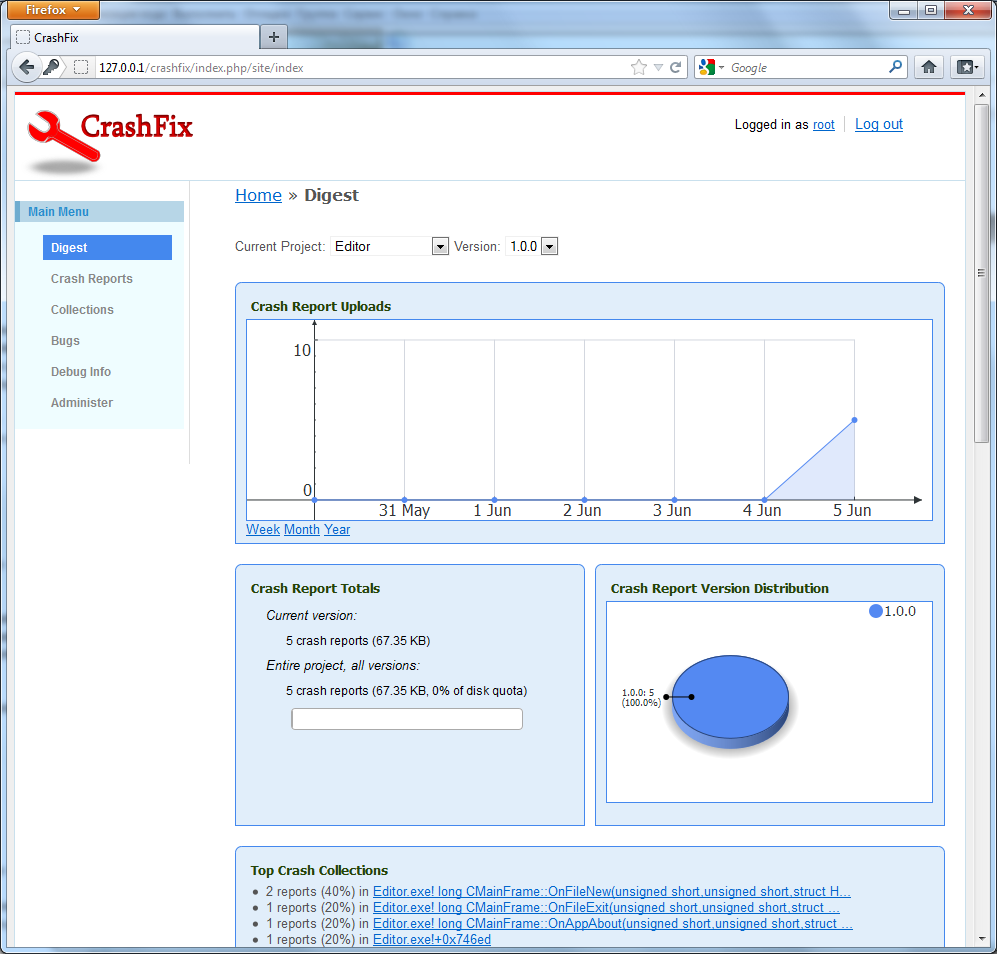
Digest
You may display statistics for the currently selected version of the current project, or you may display statistics for all versions of the current project. To display statistics for all versions, select '(all)' from the
Version drop-down list.
The following types of statistics are presented:
-
Crash Report Uploads. This diagram display how many crash reports have been received for the current project. You can show uploads for the last week, month or year.
-
Crash Report Totals. This widget displays the summary of the total crash report count for the current project and disk space occupied by the crash reports.
-
Crash Report Version Distribution. This pie chart displays how many crash reports received for each version of the current project.
-
Top Crash Collections. This widget displays the most popular crash collections. This is useful to determine what crash collection to analyze first.
-
Bug Dynamics. This graph displays recent bug dynamics: how many bugs are in total, how many of them are open/fixed/verified. You can show bug dynamics for the last week, month or year.
-
Recent Bug Changes. This widget displays ten recent bug changes. A bug change is when someone opens a bug or changes its status or adds a comment to an existing bug.
-
Debug Info Totals. This widget displays the total count of debugging symbol files for the current project and how much disk space they occupy.
-
Debug Info Uploads. This graph displays debugging symbols upload dynamics. You can show the dynamics for the last week, month or year.
Further reading: Crash Reports
 1.5.9
1.5.9